On this page ▾
Features
Each tab of the panel is an inspector. It reads your source files, your running app, or both. Agents read the same data through the agent tools. The screenshots come from the demo apps.
App structure
Dashboard
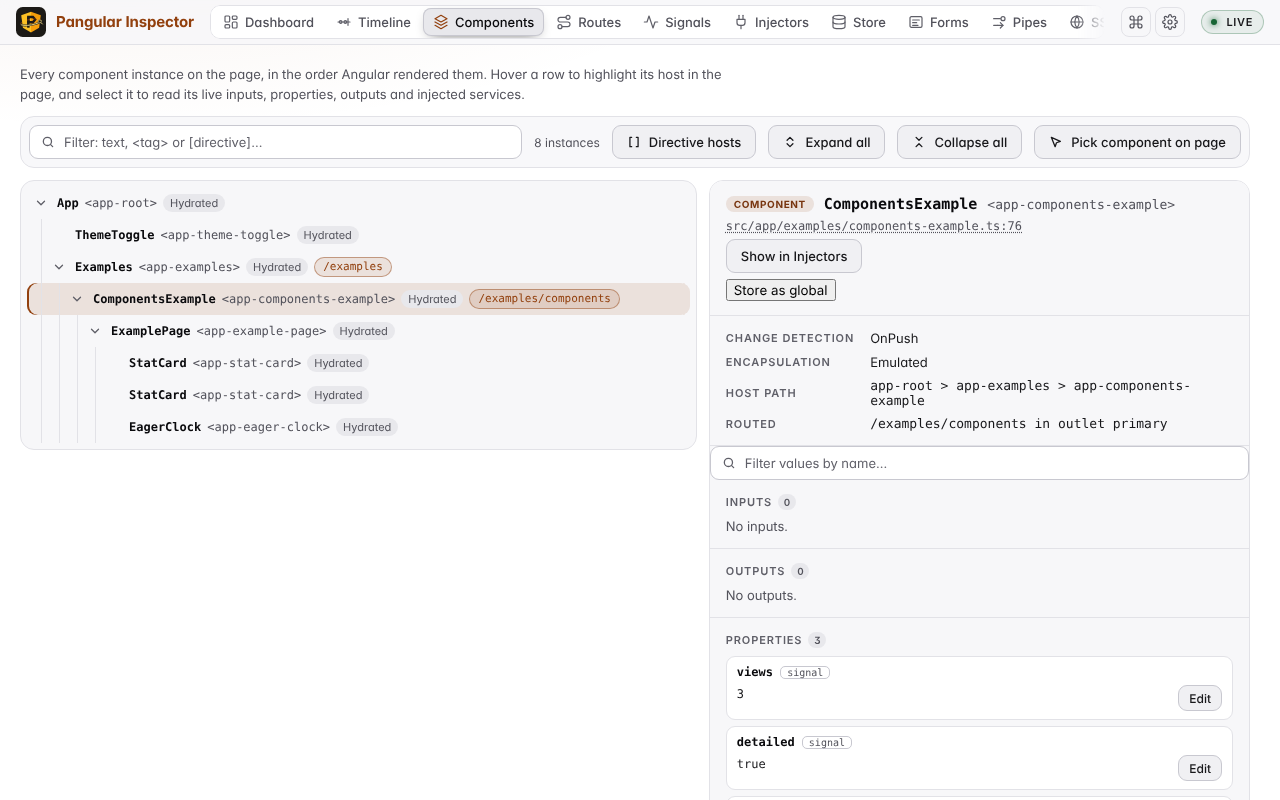
Get your bearings: the Angular and TypeScript versions, SSR, change detection mode and a count for each inspector, from the source scan and the live page. See Dashboard.
Components
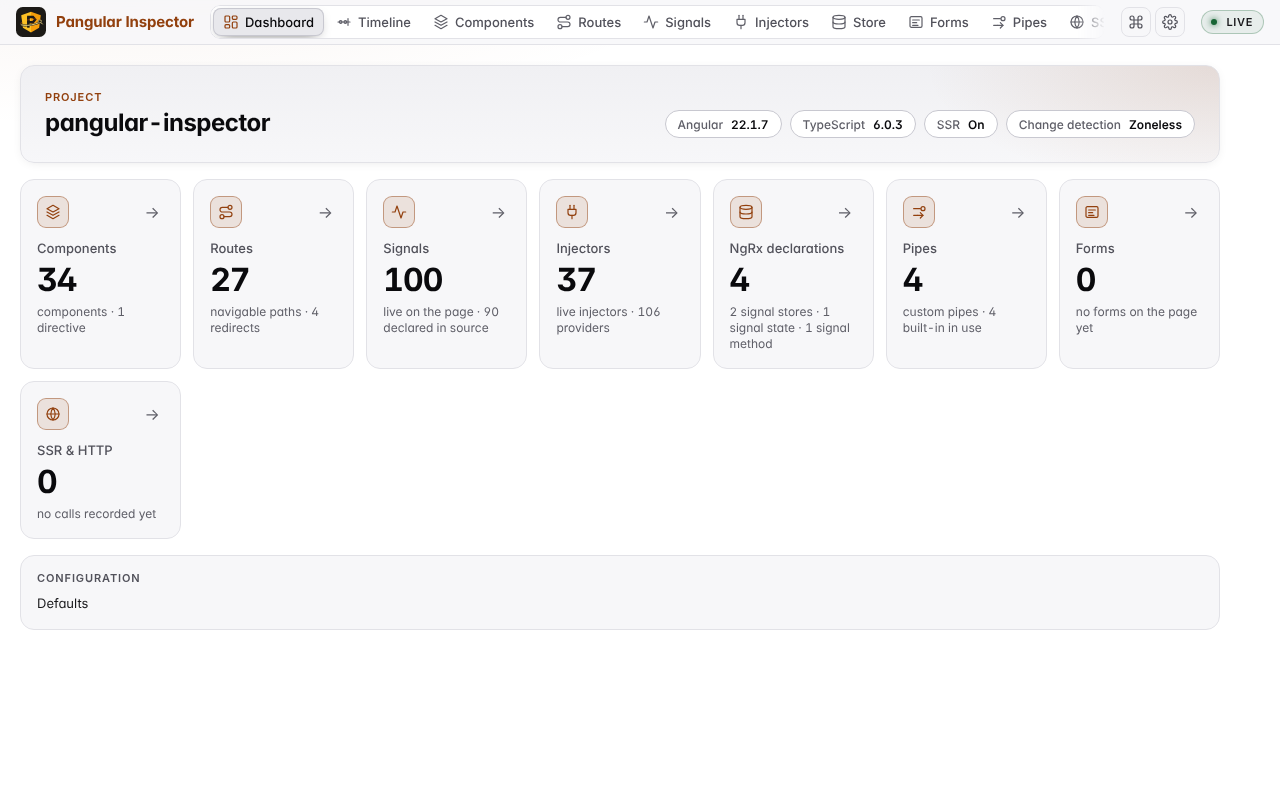
Find out what a component received and holds right now: its inputs, properties, outputs, injected services, defer blocks and @for blocks, with change detection recordings and leaks. See Components.
Injectors
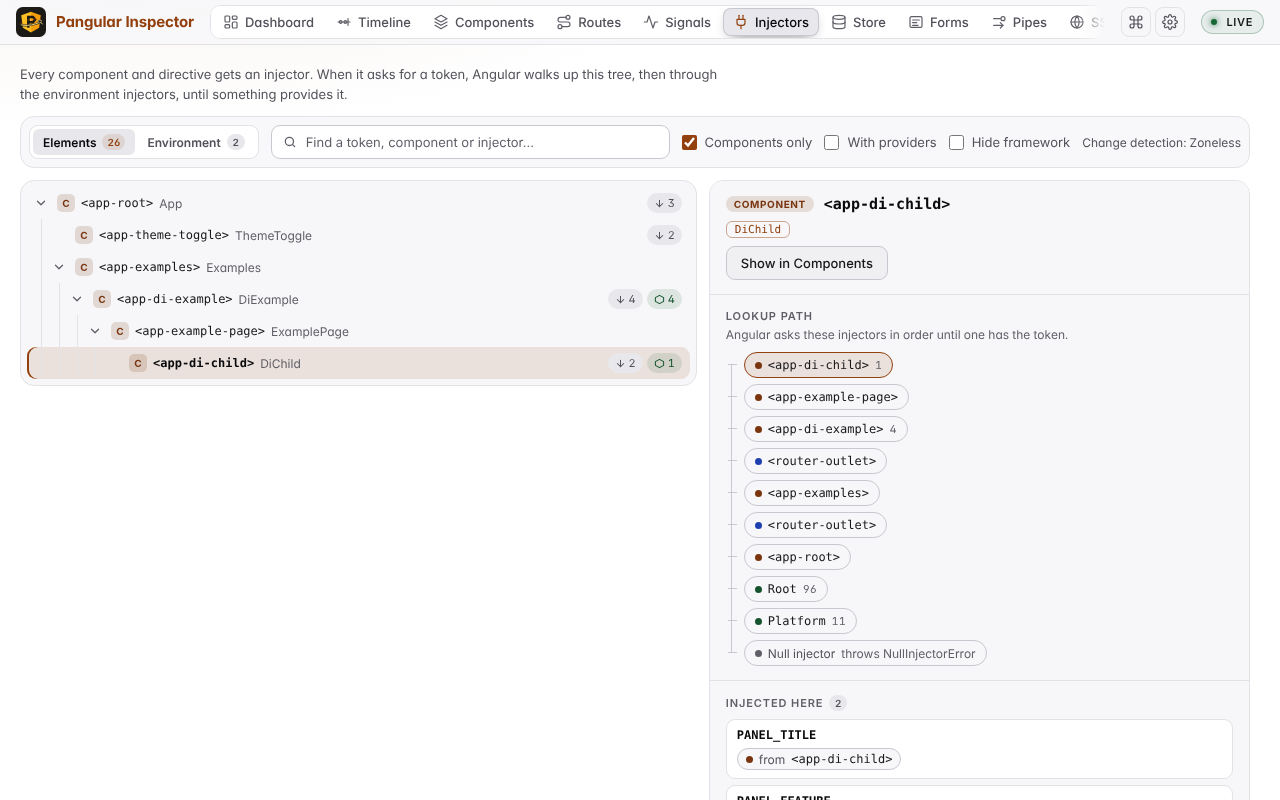
See why an injection resolved to the provider it did, or failed: the injector hierarchy, the lookup path of a token and the providers at each level. See Injectors.
Signals
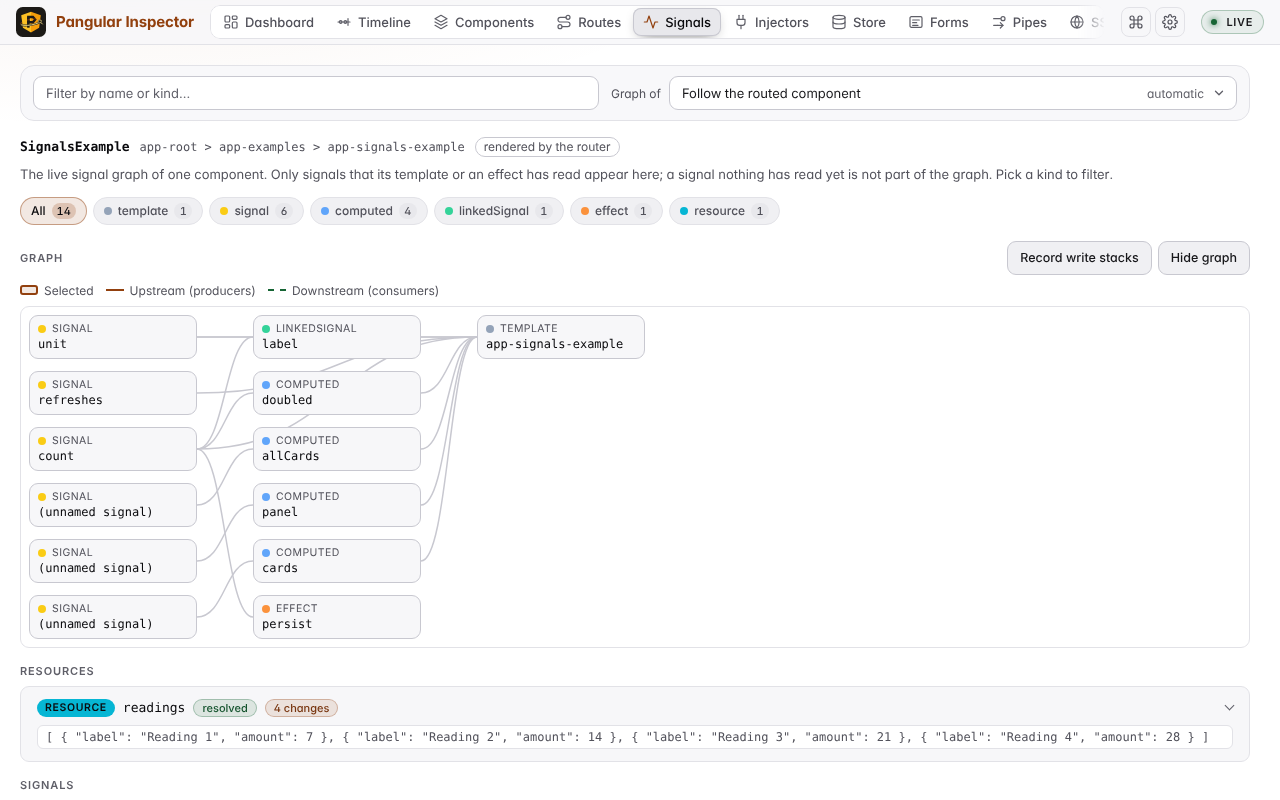
Follow a value through its producers and consumers in the live signal graph of a component or injector, with resources and a value history per signal. See Signals.
Pipes
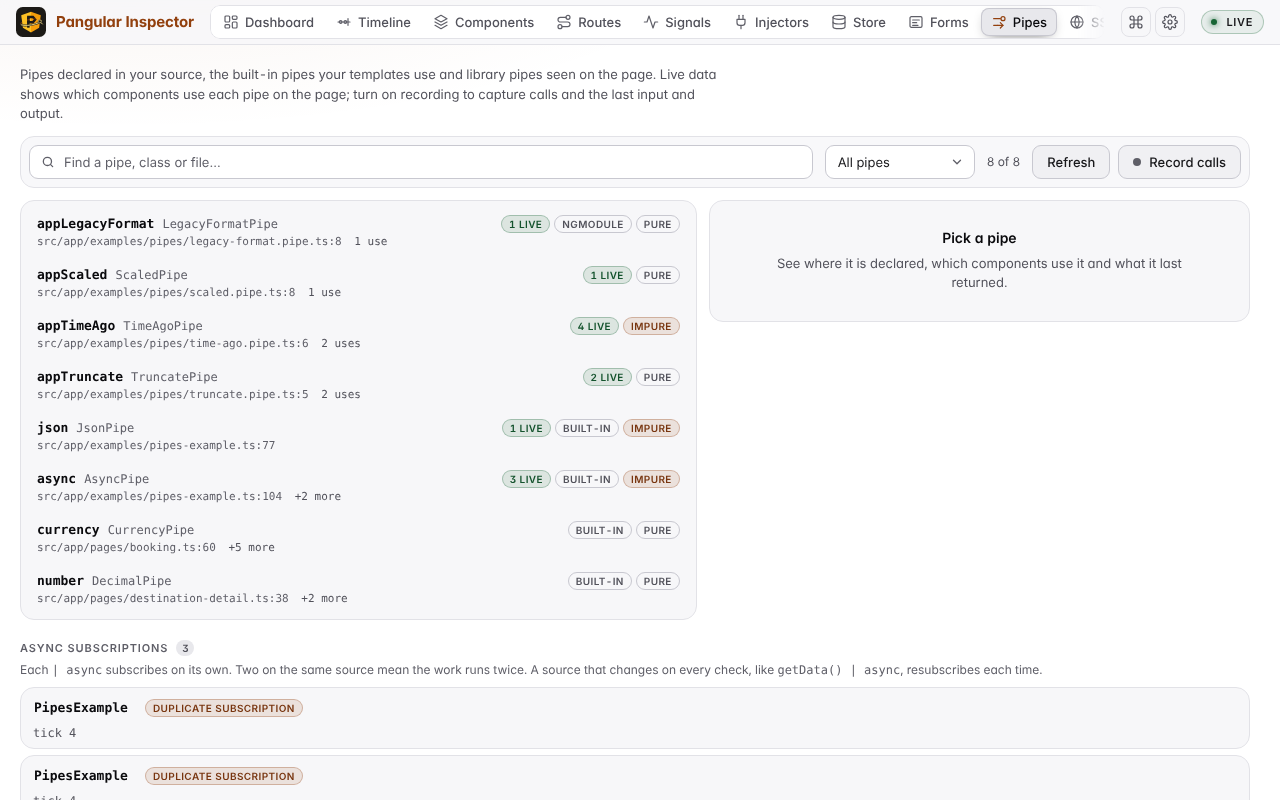
Check where custom, built-in and library pipes are used, how many instances are live, and record their calls. See Pipes.
State and data
NgRx Store
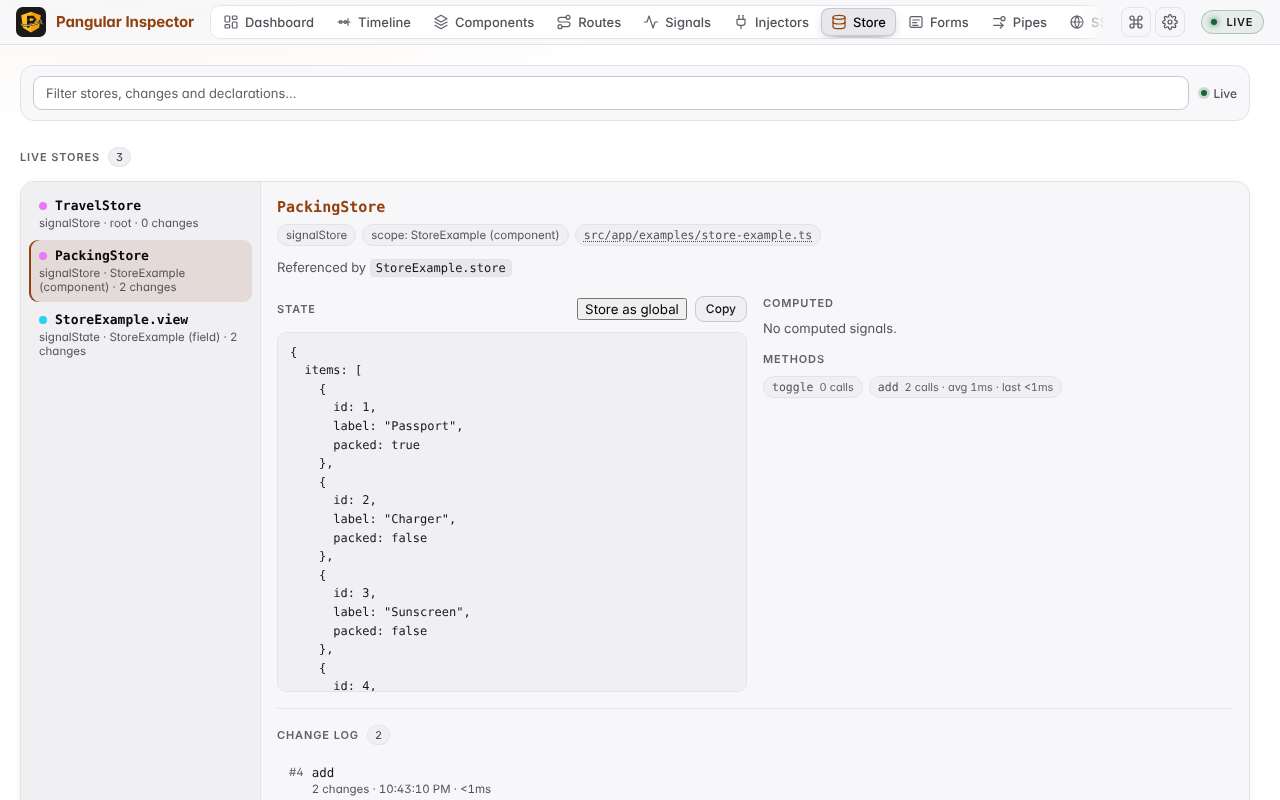
Read NgRx signal stores and @ngrx/store state with their change logs and diffs, restore an earlier state and dispatch actions. NGXS, Elf and MiniRx stores show too. See NgRx Store.
TanStack Query
See each query and mutation with its status, freshness, observers, error and data, then invalidate or refetch it. See TanStack Query.
Forms
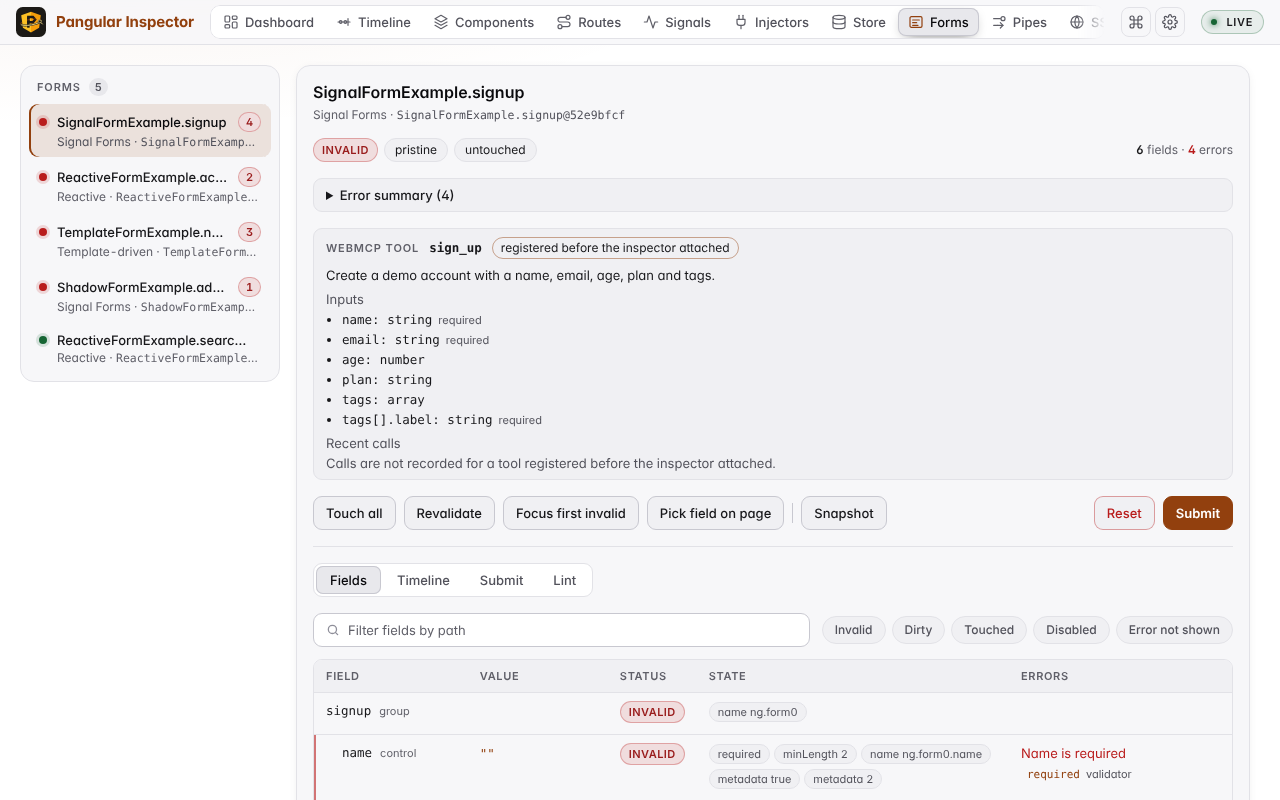
Find out why a form is invalid or did not submit: each field with its state and errors, a change timeline and a lint. See Forms.
Navigation and the network
Router
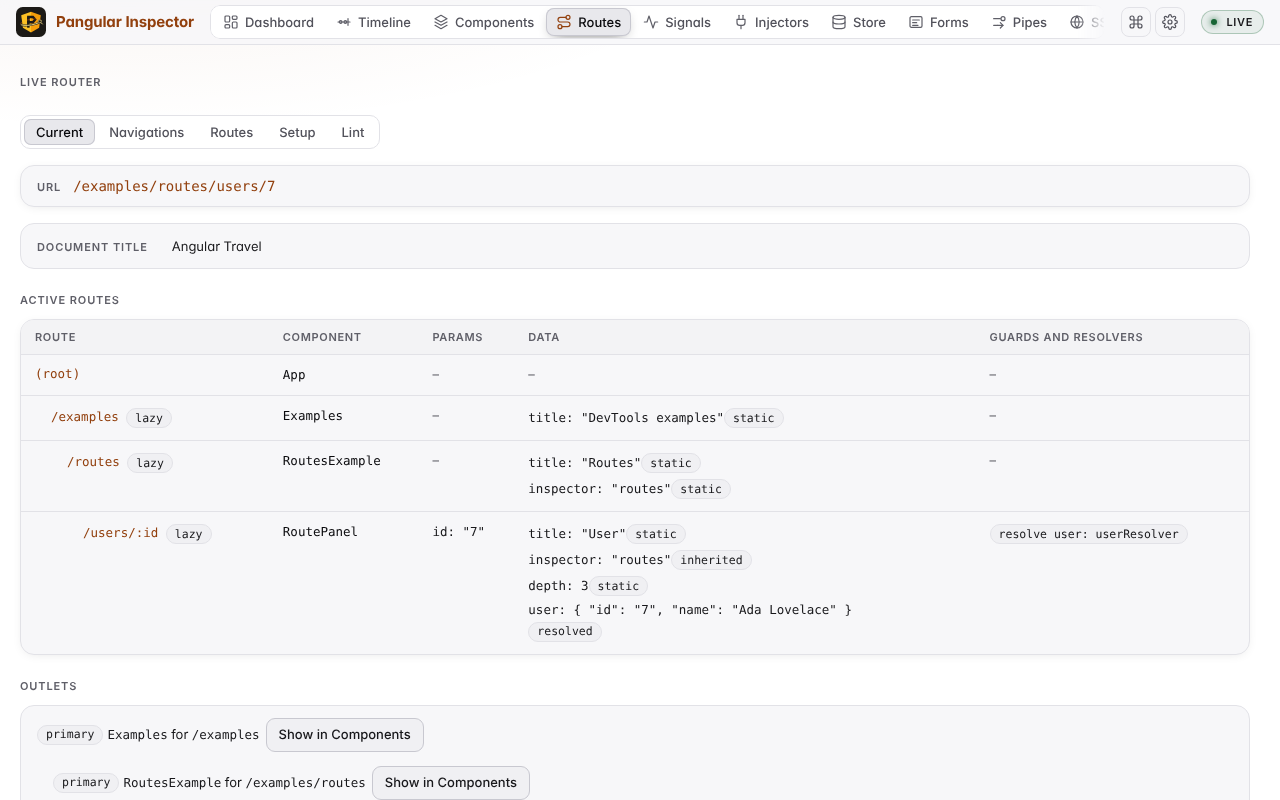
Explain a navigation: the live route, each navigation with its guards and resolvers, the route config and a route lint. See Router.
SSR & HTTP
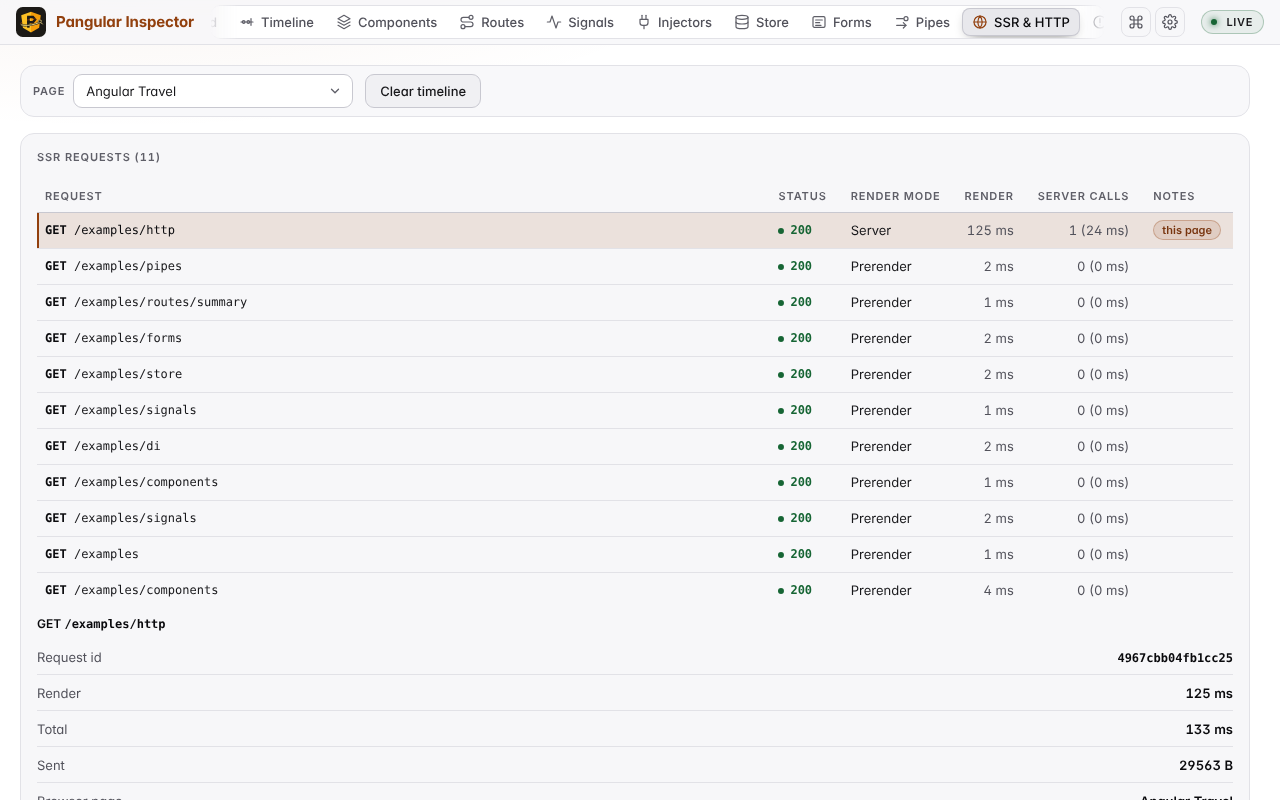
Trace an HTTP call from the server render to the browser, inject faults, and read hydration stats and the TransferState payload. See SSR & HTTP.
Timeline
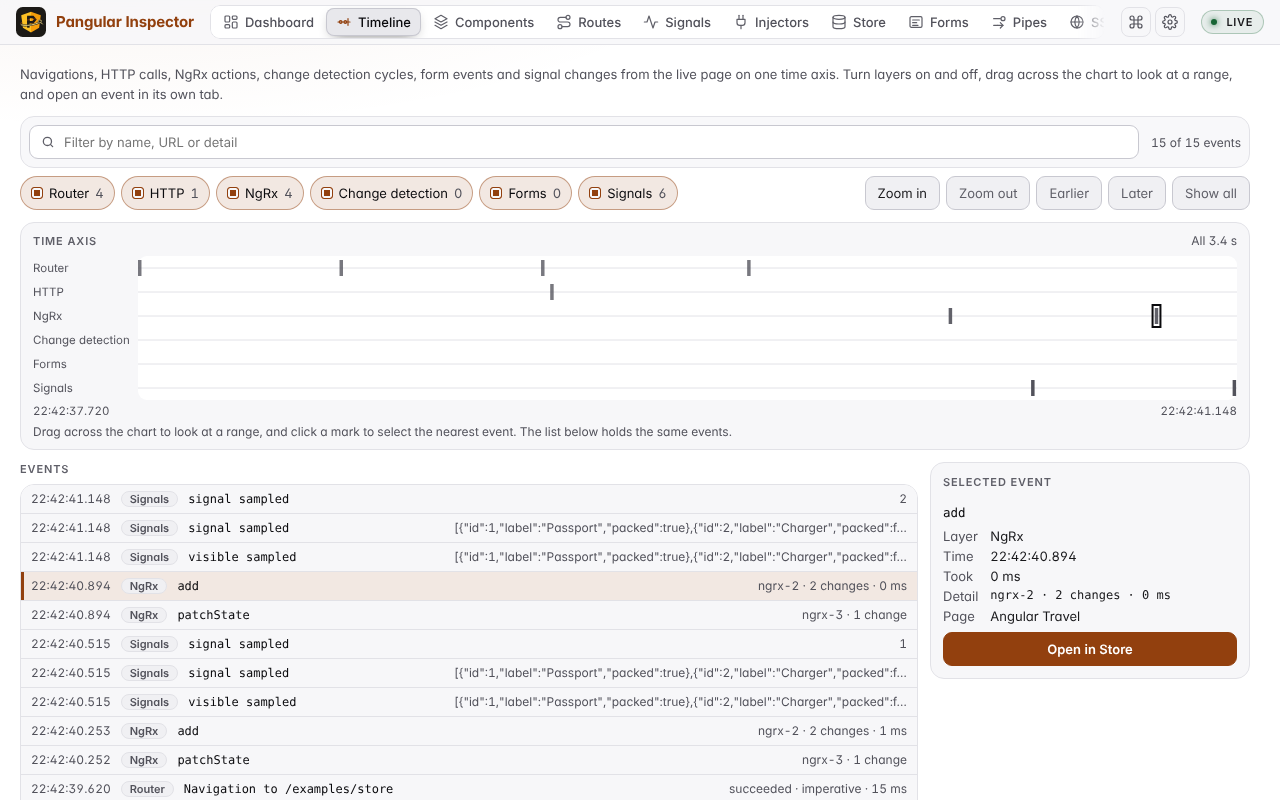
Put navigations, HTTP calls, NgRx actions, change detection, form events and signal changes on one time axis to see what happened in what order. See Timeline.
Problems
Errors
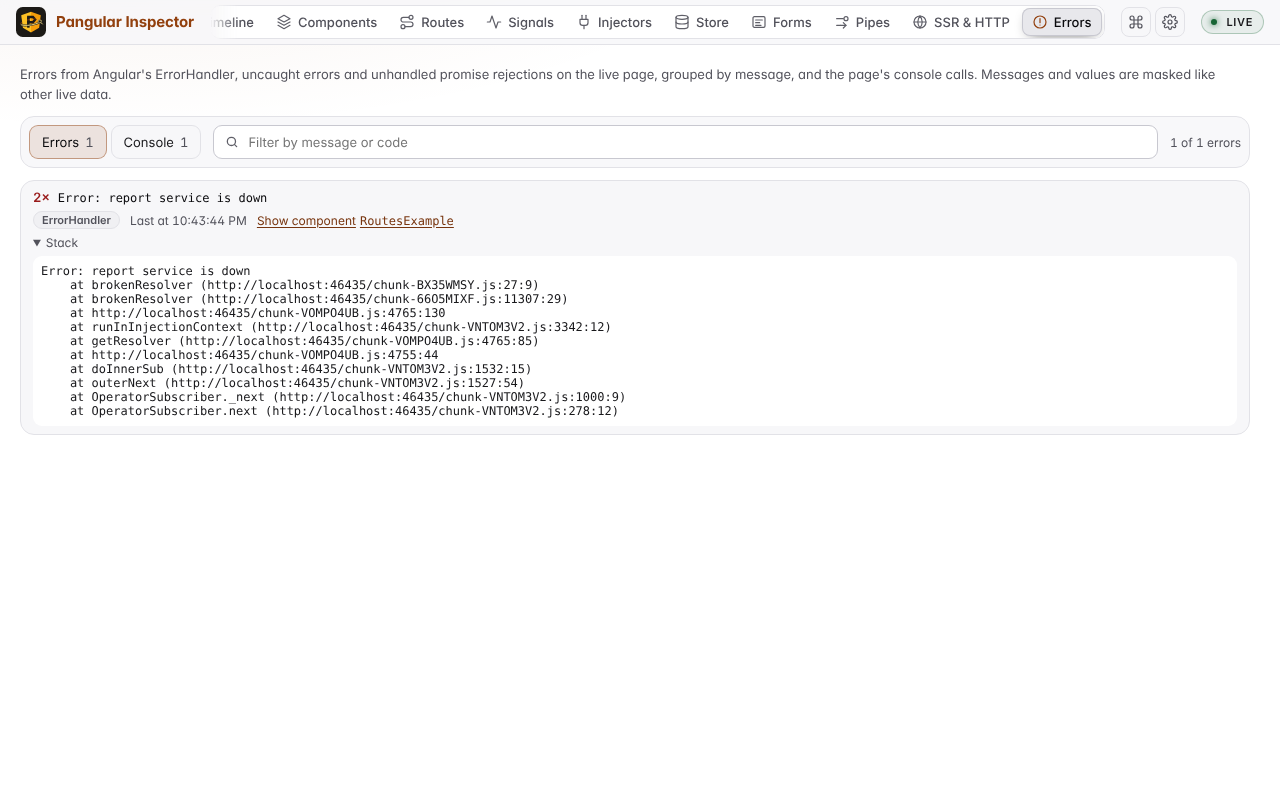
Read every error from the ErrorHandler, uncaught errors, unhandled rejections and the console, with the component that threw it, a docs link for NG0xxx codes and explainers for NG0100, hydration mismatches and missing providers. See Errors.
Audit
Get one ranked list of what the inspectors found, an axe pass over the page, and a before and after comparison of a change. See Audit.
Frameworks and platforms
Analog
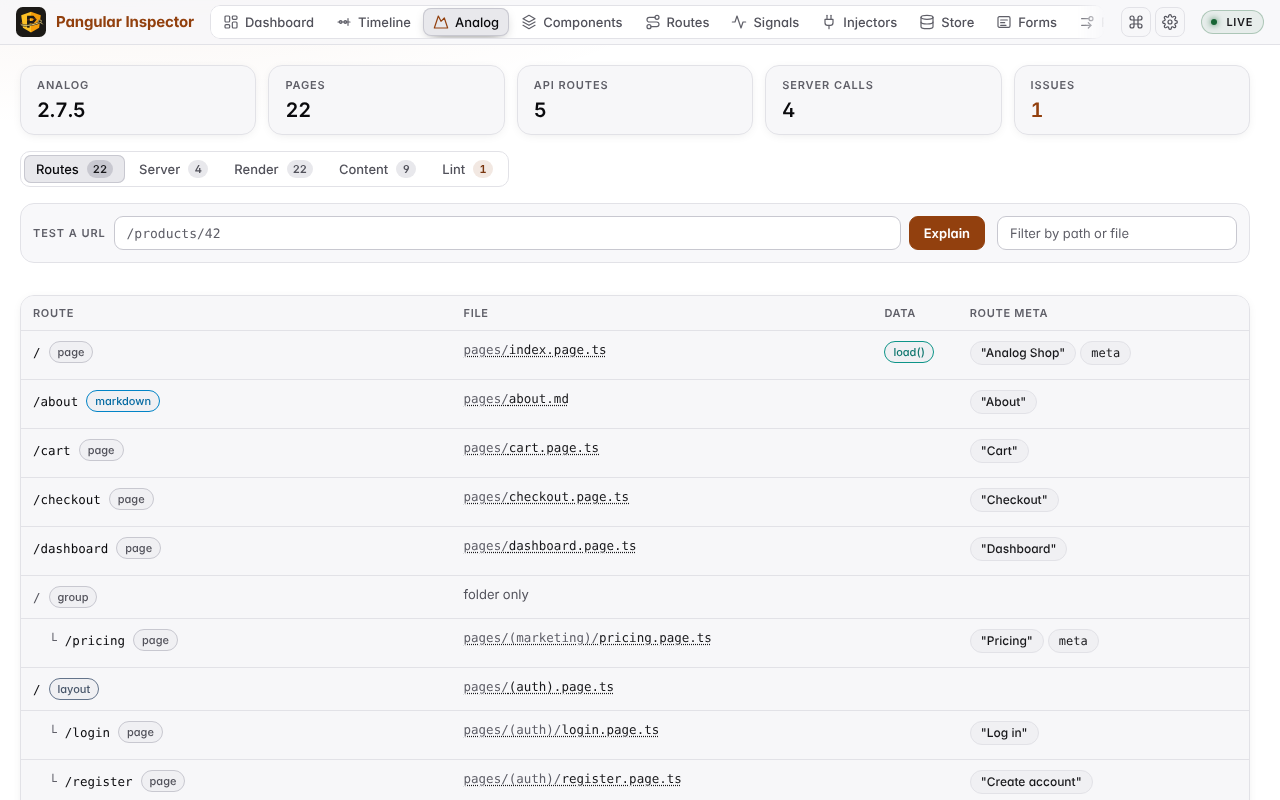
Map an Analog URL to its page, layout and server files, and list server calls, render modes, content and lint. See Analog.
Capacitor
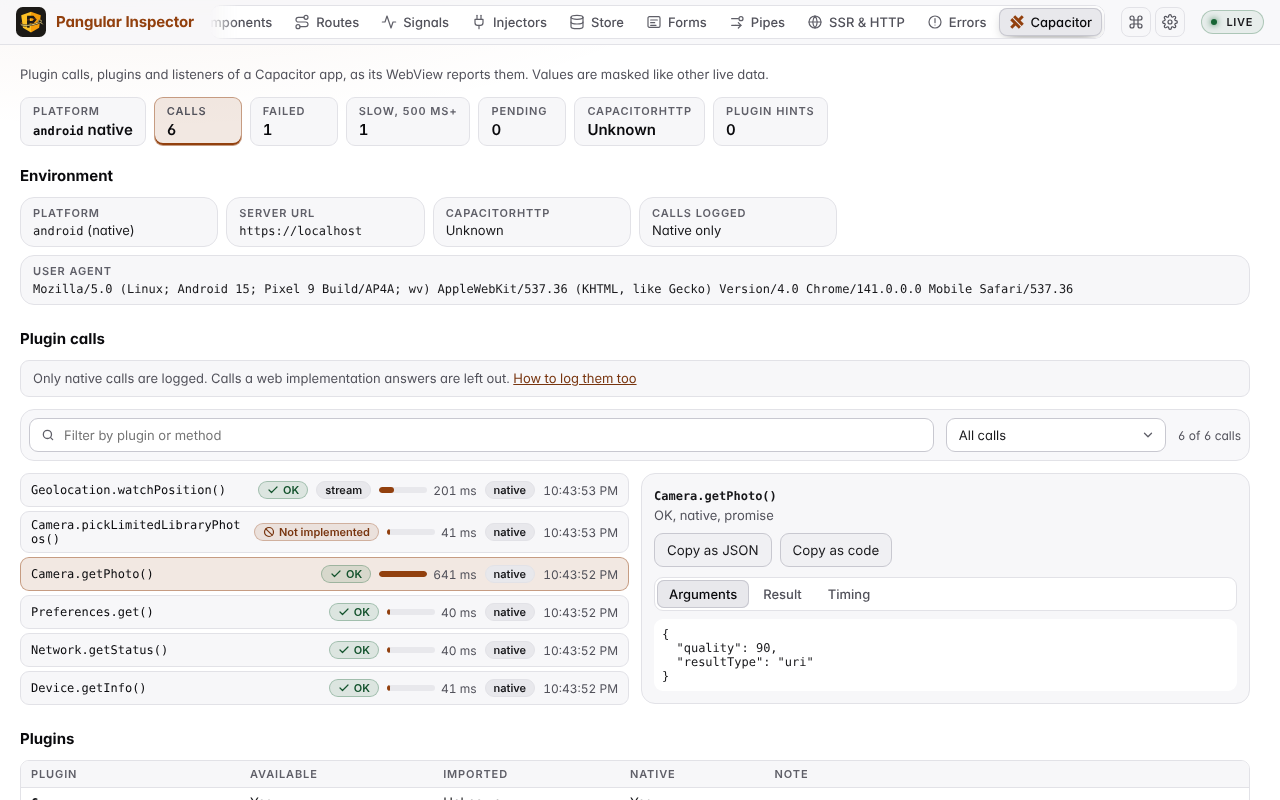
Watch a Capacitor app's plugin calls and listeners, with the platform and the plugins its WebView reports. See Capacitor.
Outside the panel
| Feature | What it does | Read more |
|---|---|---|
| Agent tools over MCP | The same data and actions for a coding agent, over HTTP or stdio. | MCP server |
| Browser agents | Read-only tools registered on the page through WebMCP, off by default. | Browser agents |
| Standalone CLI | A local server, a static report, an MCP server and a lint export, without your app running. | Standalone CLI |
| Chrome extension | The panel inside Chrome DevTools, following the Elements panel. | Chrome extension |
| Command palette | Any tab or action from the keyboard. | Command palette |
| Plugins | A library's own tab and agent tools. | Write a plugin |
Which Angular version each feature needs
Most tabs work from Angular 12.2. Some features read debug APIs that later releases added, such as the live signal graph (20.1) and change detection recording (20.0). Supported Angular versions lists the minimum version of each feature.